this will produce a ggplot2 or plotly histogram plot of the
density information provided from the hai_get_density_data_tbl function.
Usage
hai_density_qq_plot(
  .data,
  .dist_name_col = distribution,
  .x_col = x,
  .y_col = y,
  .size = 1,
  .alpha = 0.382,
  .interactive = FALSE
)
Arguments
- .data
The data that is produced from using
hai_get_density_data_tbl- .dist_name_col
The column that has the distribution name, should be distribution and that is set as the default.
- .x_col
The column that contains the x values that comes from the
hai_get_density_data_tblfunction.- .y_col
The column that contains the y values that comes from the
hai_get_density_data_tblfunction.- .size
The size parameter for ggplot
- .alpha
The alpha parameter for ggplot
- .interactive
This is a Boolean fo TRUE/FALSE and is defaulted to FALSE. TRUE will produce a
plotlyplot.
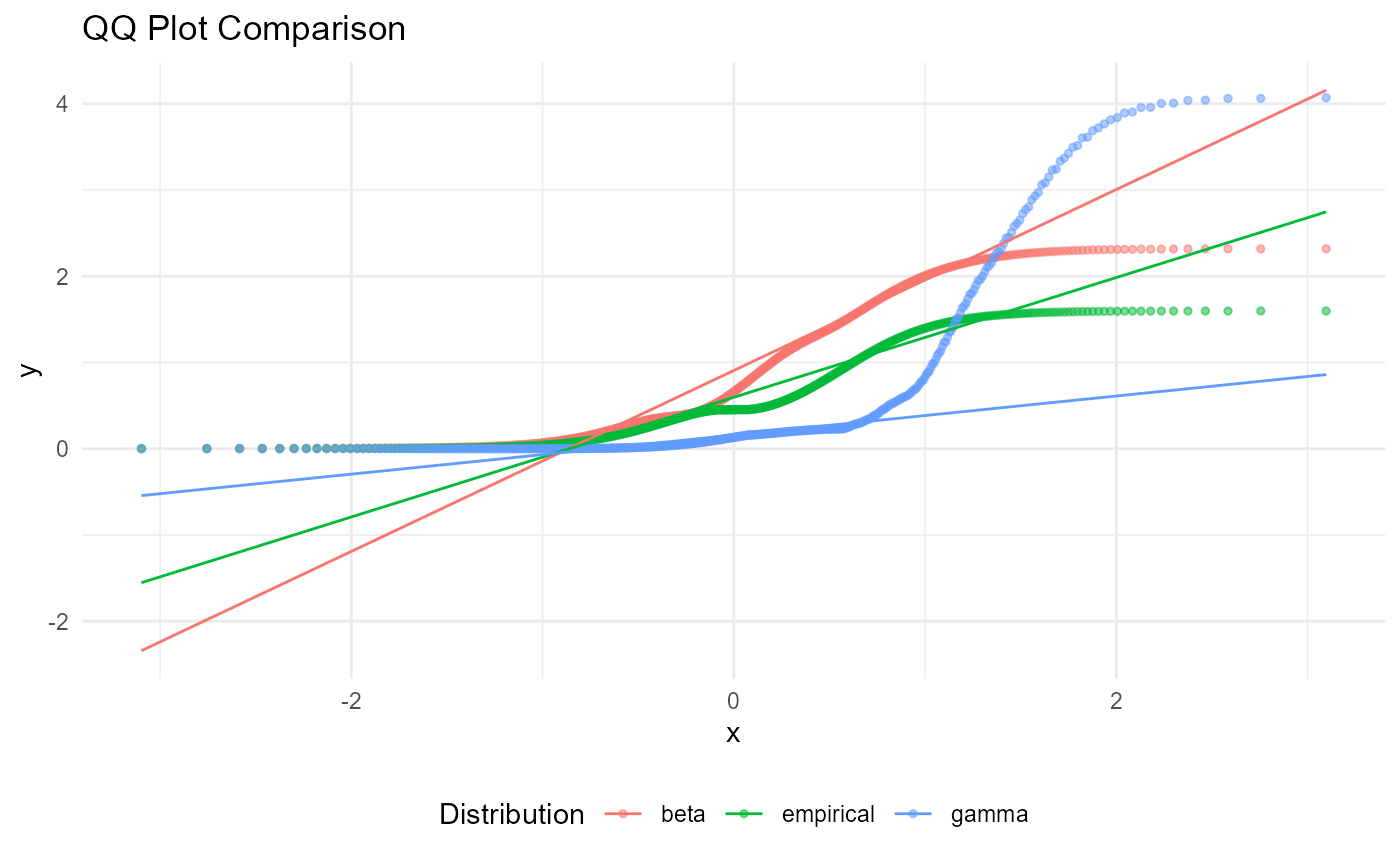
Details
This will produce a qq plot of the density information that is
produced from the function hai_get_density_data_tbl. It will look for an attribute
from the .data param to ensure the function was used.
See also
Other Distribution Plots:
hai_density_hist_plot(),
hai_density_plot()
Examples
library(dplyr)

df <- hai_scale_zero_one_vec(.x = mtcars$mpg) %>%
  hai_distribution_comparison_tbl()

tidy_density_tbl <- hai_get_density_data_tbl(df)

hai_density_qq_plot(
  .data = tidy_density_tbl,
  .dist_name_col = distribution,
  .x_col = x,
  .y_col = y,
  .size = 1,
  .alpha = 0.5,
  .interactive = FALSE
)