Generate Random Walks
Value
A tibble in long format with columns walk, x, and value,
representing the random walks. Additionally, attributes num_walks,
num_steps, mu, and sd are attached to the tibble.
Details
The function generates random walks using the normal distribution with a
specified mean (mu) and standard deviation (sd).
Each walk is generated independently and stored in a tibble. The resulting
tibble is then pivoted into a long format for easier analysis.
Author
Steven P. Sanderson II, MPH
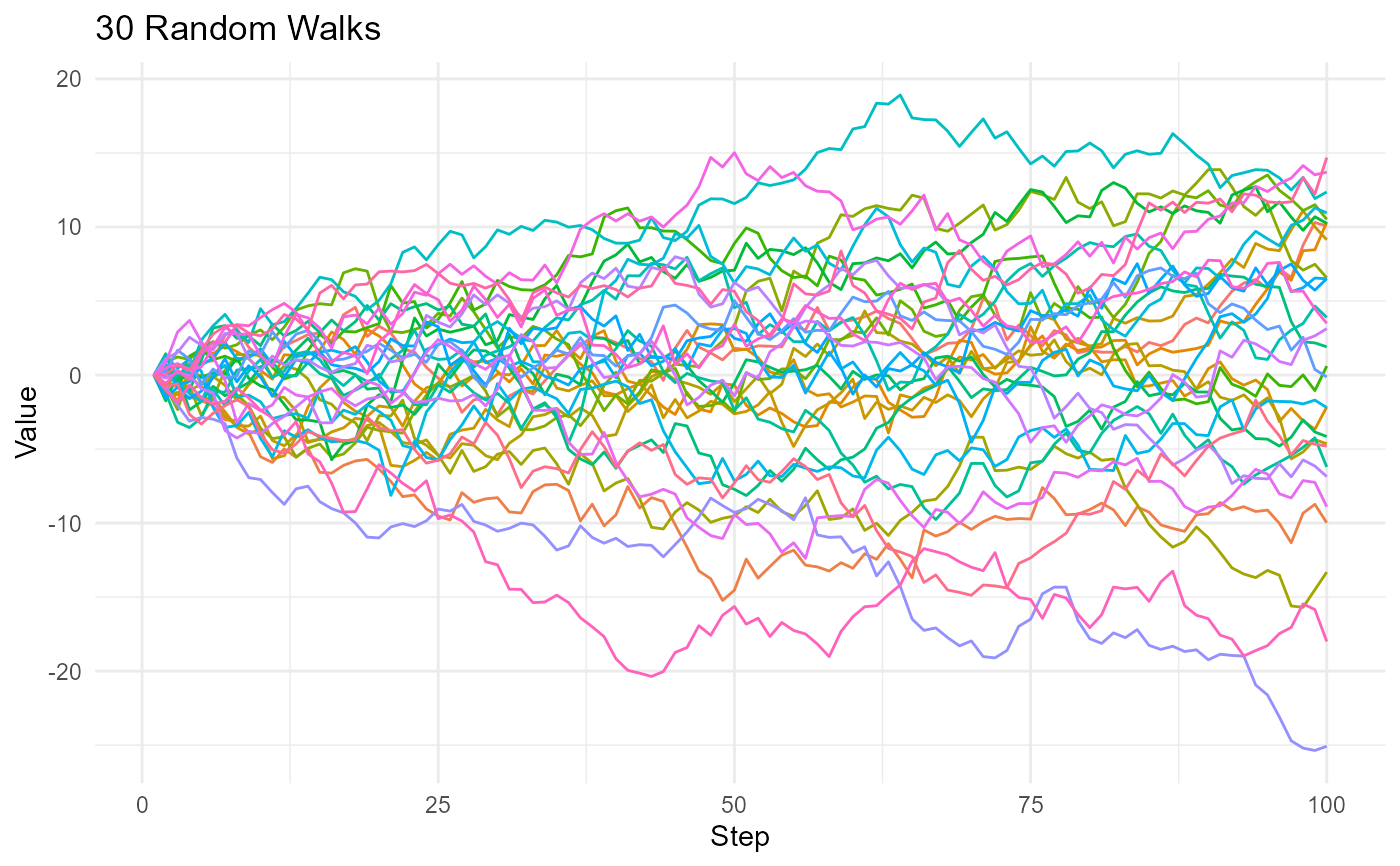
This function generates 30 random walks with 100 steps each and pivots the result into a long format tibble.
Examples
# Generate random walks and print the result
set.seed(123)
rw30()
#> # A tibble: 3,000 × 3
#>    walk_number step_number      y
#>    <fct>             <int>  <dbl>
#>  1 1                     1  0
#>  2 1                     2 -0.560
#>  3 1                     3 -0.791
#>  4 1                     4  0.768
#>  5 1                     5  0.839
#>  6 1                     6  0.968
#>  7 1                     7  2.68
#>  8 1                     8  3.14
#>  9 1                     9  1.88
#> 10 1                    10  1.19
#> # ℹ 2,990 more rows

set.seed(123)
rw30() |>
 visualize_walks()