visualize_walks() visualizes the output of the random walk functions in the RandomWalker package, resulting in one or more ggplot2 plots put together in a patchwork composed of 1 or more patches.
Arguments
- .data
The input data. Assumed to be created by one of the random walk functions in the RandomWalker package, but can be any data frame or tibble that contains columns
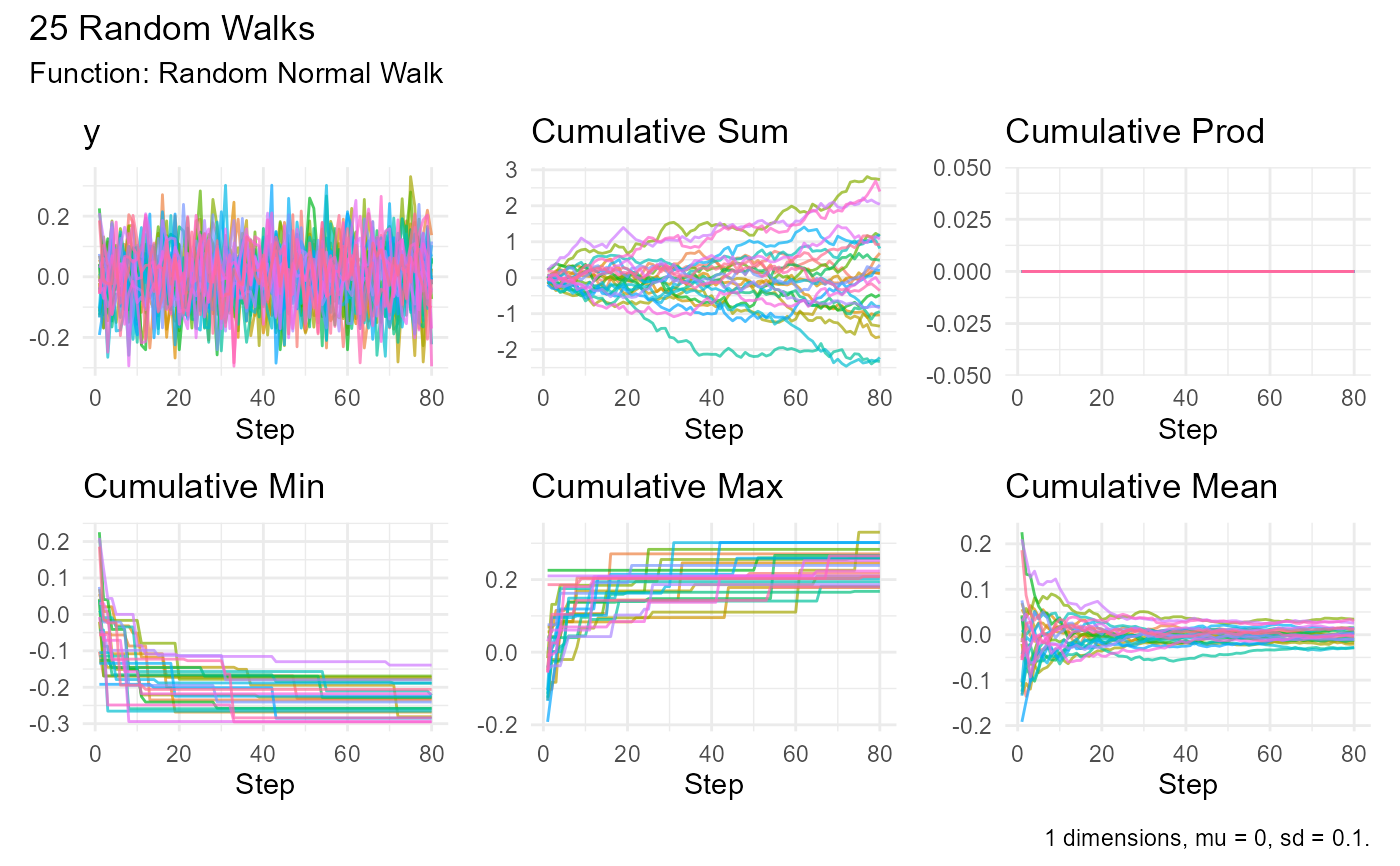
walk_number,x, and one or more numeric columns likey,cum_sum,cum_prod,cum_min,cum_maxandcum_mean, for instance.- .alpha
The alpha value for all the line charts in the visualization. Values range from 0 to 1. Default is 0.7.
- .interactive
A boolean value. TRUE if you want the patches to be interactive. FALSE if you don't. Default is FALSE.
- .pluck
If you want to visualize only one of the You can choose one of the values (
y,cum_sum,cum_prod,cum_min,cum_max,cum_mean). Default is FALSE.
Details
visualize_walks() generates visualizations of the random walks generated by the random walk functions in the RandomWalker package. These are the functions at the moment of writing:
brownian_motion()
discrete_walk()
geometric_brownian_motion()
random_normal_drift_walk()
random_normal_walk()
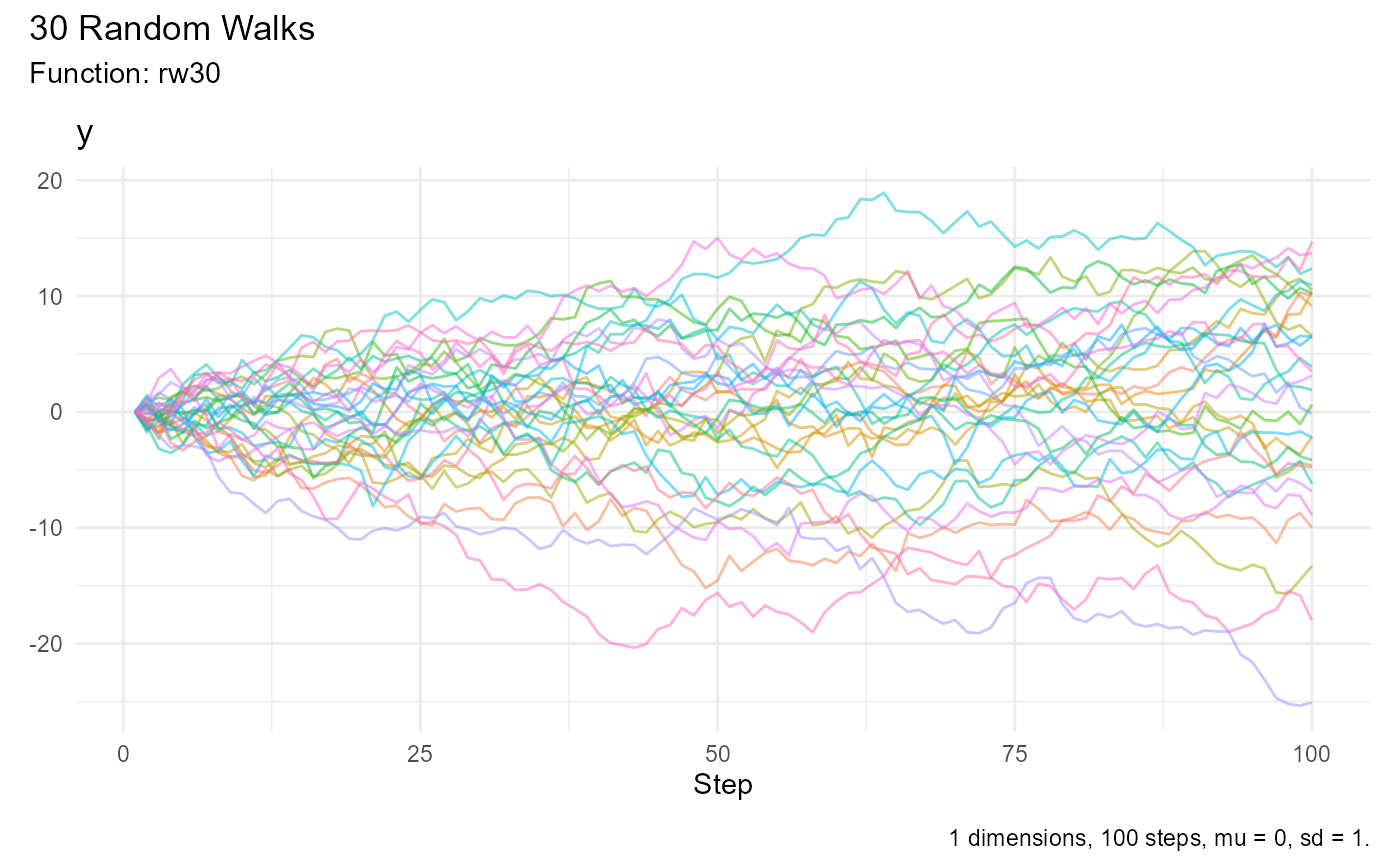
rw30()
It is possible there are more when you read this, but you can check the rest of the documentation for the current situation.
The visualization function is meant to be easy to use. No parameters needed,
but you can set .alpha if the default value of 0.7 isn't to your
liking.
You can also choose whether you want the visualization to be interactive or
not by setting .interactive to TRUE. The function uses the ggiraph
package for making the patches interactive.
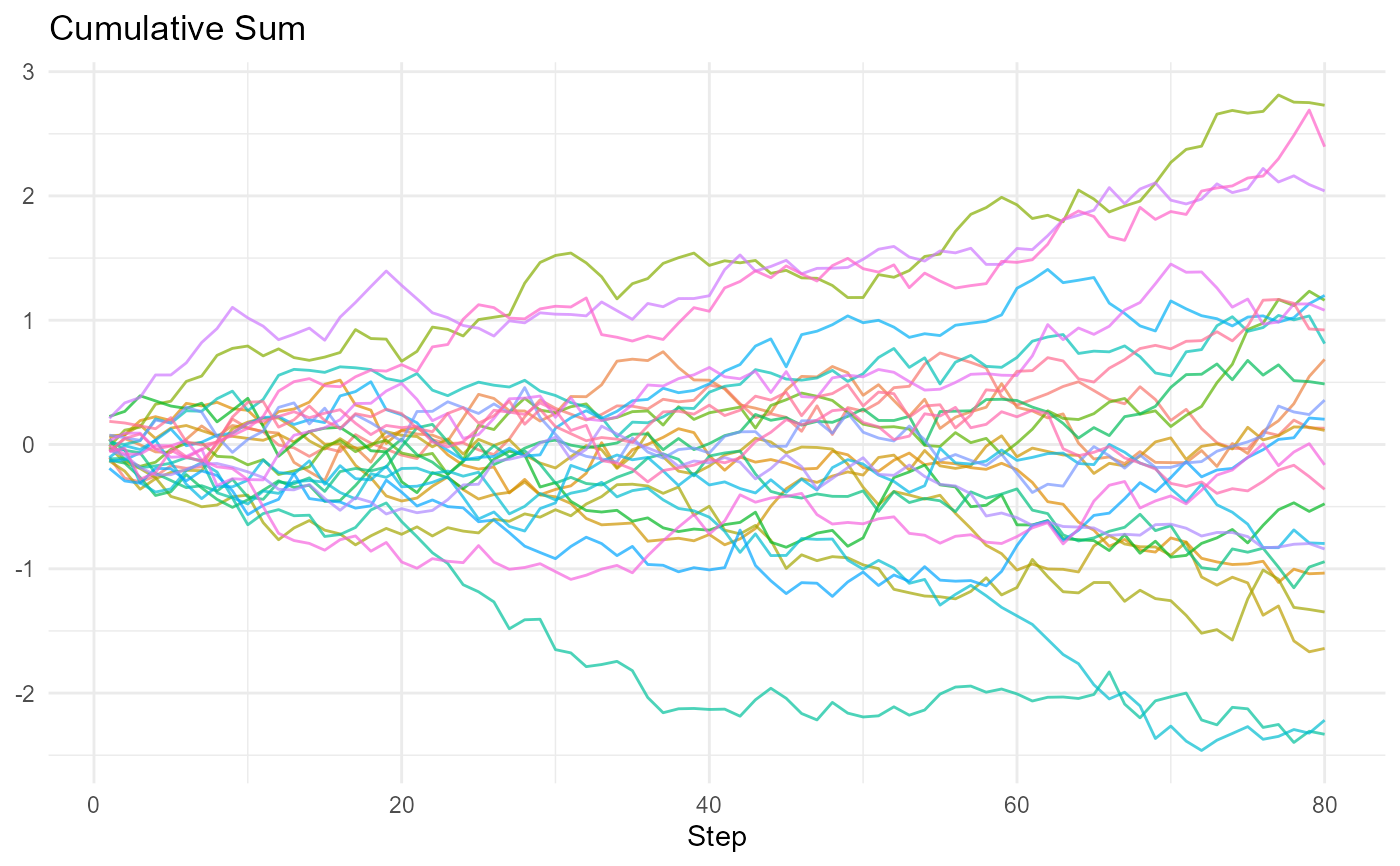
If you want to visualize only one of the attributes, you can choose use one of
these values (y, cum_sum, cum_prod, cum_min, cum_max, cum_mean) for
the .pluck parameter.
Examples
# Generate random walks and visualize the result
set.seed(123)
rw30() |>
visualize_walks()
 # Set the alpha value to be other than the default 0.7
set.seed(123)
rw30() |>
visualize_walks(.alpha = 0.5)
# Set the alpha value to be other than the default 0.7
set.seed(123)
rw30() |>
visualize_walks(.alpha = 0.5)
 # Use the function with an input that has alternatives for y
set.seed(123)
random_normal_walk(.num_walks = 5, .initial_value = 100) |>
visualize_walks()
# Use the function with an input that has alternatives for y
set.seed(123)
random_normal_walk(.num_walks = 5, .initial_value = 100) |>
visualize_walks()
 # Use the function to create interactive visualizations
set.seed(123)
random_normal_walk(.num_walks = 5, .initial_value = 100) |>
visualize_walks(.interactive = TRUE)
# Use .pluck to pick just one visualization
set.seed(123)
random_normal_walk(.num_walks = 5, .initial_value = 100) |>
visualize_walks(.pluck = c(1, 3))
# Use the function to create interactive visualizations
set.seed(123)
random_normal_walk(.num_walks = 5, .initial_value = 100) |>
visualize_walks(.interactive = TRUE)
# Use .pluck to pick just one visualization
set.seed(123)
random_normal_walk(.num_walks = 5, .initial_value = 100) |>
visualize_walks(.pluck = c(1, 3))